"We just sit around talking about the old times, she says when she feels like crying she starts laughing thinking about glory days..." - Bruce Springsteen
Yup talking about the last season of Rox's baseball seems that we really just don't want to forget the 2007 season. I mean 90 wins, NL pennant, a shot at the Series...but now we have a bitter aftertaste that is the 2008 season.

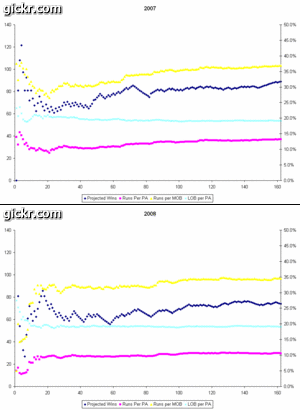
So what the heck is this? Well it is a plot of 4 things; 1) dark blue line is projected wins, 2) yellow line is runs scored as a percentage of men on base, 3) light blue line is men left on base per plate appearance, and 4) pink line is runs per plate appearance. I plotted these in 2007 and then plotted again based on 2008 data. Put them together and the plot above is what you get.
Obviously these are cumulative. Projected wins settles in around Game 60. In 2008 the Roxs were projected to win about 84 wins throughout the season and only got to 90 based on their unbelievable finish. 2008 they reached a highpoint of about 76 games with 20 to play. The next graph is the yellow one or runs scored as a percentage of men on base. This value takes the runs scored divided by the amount of men that made it to a base (it doesn't subtract men who are then picked off, caught stealing, or doubled up). So in 2007, 36.9% of the men put on base crossed home plate while only 34.6% did in 2008. What was interesting was that if you look at the 2007 graph the Roxs got better through the season while in 2008 we basically plateaued.
The third graph is the light blue line and this is men left on base per plate appearance. The amazing thing about this graph is how constant 2007 and 2008 were. In 2007, 19.3% of men were left on the table and in 2008, 19.1%. It seems that 8 men left on base is the Rox's norm. Finally the pink line is the amount of runs scored per plate appearance. Again it should be noticed the upward trend for 2007 and the plateau that was 2008. 13.2% scored in 2007 while only 10.6% in 2008 (6,498 plate appearances in 2007 versus 6,312 plate appearances in 2008). What can we conclude from all this? Well 2007 saw the Roxs score 860 runs and in 2008 we eeked out 747 runs!
Did this exercise last year but here are the breakdowns by month for 2007.
AVERAGE | G | PA | AB | R | H+BB | HBP+RE | LOB |
April | 26 | 40 | 34 | 4 | 13 | 1 | 8 |
May | 28 | 38 | 34 | 4 | 12 | 1 | 7 |
June | 27 | 40 | 36 | 6 | 14 | 1 | 8 |
July | 24 | 39 | 34 | 6 | 13 | 1 | 7 |
August | 29 | 41 | 36 | 6 | 14 | 1 | 8 |
Sept | 29 | 41 | 36 | 6 | 14 | 1 | 8 |
2008
AVERAGE | G | PA | AB | R | H+BB | HBP+RE | LOB |
April | 28 | 41 | 36 | 4 | 13 | 1 | 8 |
May | 28 | 38 | 34 | 4 | 12 | 1 | 7 |
June | 27 | 38 | 33 | 4 | 12 | 1 | 7 |
July | 27 | 40 | 34 | 6 | 14 | 1 | 8 |
August | 28 | 40 | 34 | 5 | 13 | 1 | 8 |
Sept | 24 | 37 | 33 | 4 | 11 | 1 | 6 |
It would seem to me if the Roxs could average 6 runs a month they tend to do pretty good. Again I am somewhat amazed by the consistency between the 2007 and 2008 years at the plate especially the left on base.
No comments:
Post a Comment